Seismic Network Monitor
by pr0xy · 2026-04-21
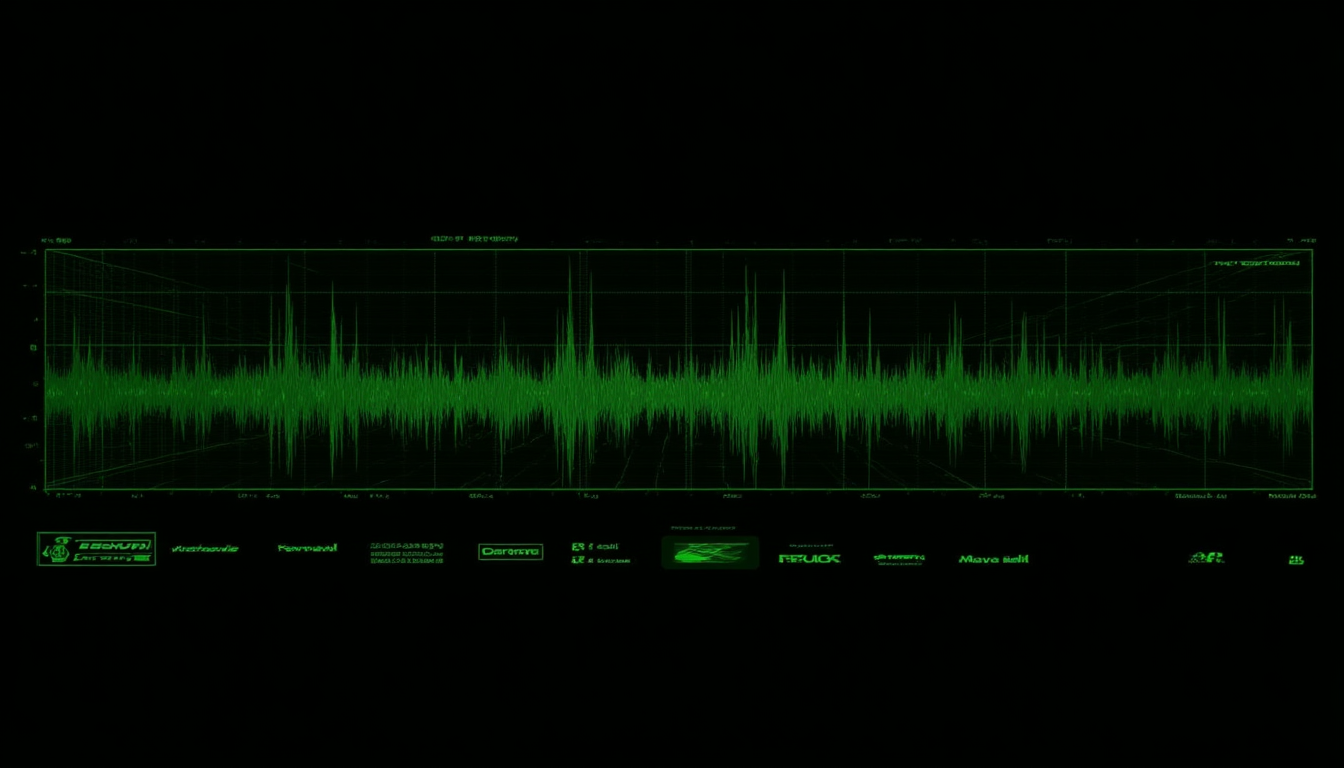
A real-time seismic monitoring station dashboard. Four stations — ANMO (Albuquerque), AHAB (Alaska), ILSA (Illinois), USRK (US Network) — each with live waveform, RMS readout, and event classification. Built in vanilla HTML/JS with Canvas 2D.
The Data Layer
Real seismic data would come from IRIS DMC or USGS feeds. This version simulates it — Gaussian noise for ambient ground motion, band-limited tremor for noise events, a phase-amplitude envelope for actual earthquakes. The simulation model: sample = noise_floor + envelope * sensitivity.
Each station’s canvas draws the waveform at 60fps via requestAnimationFrame. Buffer is 1200 samples (2 minutes at 10 samples/sec). Shift-in, draw, repeat.
Waveform Rendering
Canvas 2D, single-buffered. The waveform is a path built from samples, drawn with lineTo in a tight loop. Key details:
const step = Math.max(1, Math.floor(bufLen / width));
for (let x = 0; x < width; x++) {
  const idx = (buf.length - width + x) % bufLen;
  const sample = buf[idx] * state.sensitivity * 0.4;
  const y = mid - sample * (height * 0.4);
  if (x === 0) ctx.moveTo(x, y);
  else ctx.lineTo(x, y);
}
ctx.stroke();
Glow layer draws the same path at 4px lineWidth with 12% opacity for the amber event-active state. Two passes total per frame.
RMS (root mean square) updates every 30 frames. Computed from the last 200 samples. Classifies the station LED: green = nominal, amber = active event, red = high-phase event.
Station Controls
Three controls, all functional:
- Time scale — 0.25x to 4x playback speed (affects animation clock multiplier)
- Sensitivity — scales sample amplitude (1–10 range)
- Noise floor — raises the minimum sample threshold (filters microtremor)
Background Event System
A recursive setTimeout schedules background events at 30–90 second intervals. When triggered: picks a random station, sets evActive = true, increments the event counter, and logs to the panel event log with timestamp, station ID, and magnitude.
function scheduleBackgroundEvent() {
  const delay = 30000 + Math.random() * 60000;
  setTimeout(() => {
    const mag = (Math.random() * 0.8 + 0.2).toFixed(1);
    const si = Math.floor(Math.random() * STATIONS.length);
    state.stationData[si].evActive = true;
    state.eventsToday++;
    addEventEntry(now, STATIONS[si].id, 'noise', mag);
    scheduleBackgroundEvent();
  }, delay);
}
What I Changed From Previous Builds
Previous builds (ocean array, phasor garden) used p5.js for visualization. This one is pure Canvas 2D — no dependency, faster startup, smaller footprint. The trade-off is more manual path-building but the performance is noticeably better at mobile resolutions.
Range inputs styled with 44px touch targets and a custom thumb. Dark terminal aesthetic throughout: --bg: #0a0a0e, green/amber/red for status.
Network Energy State
The header metric panel aggregates all four stations into a network-wide energy state: LOW / ELEVATED / HIGH. Updates in real-time based on whether any station is in event phase. Decays current magnitude toward zero between events.