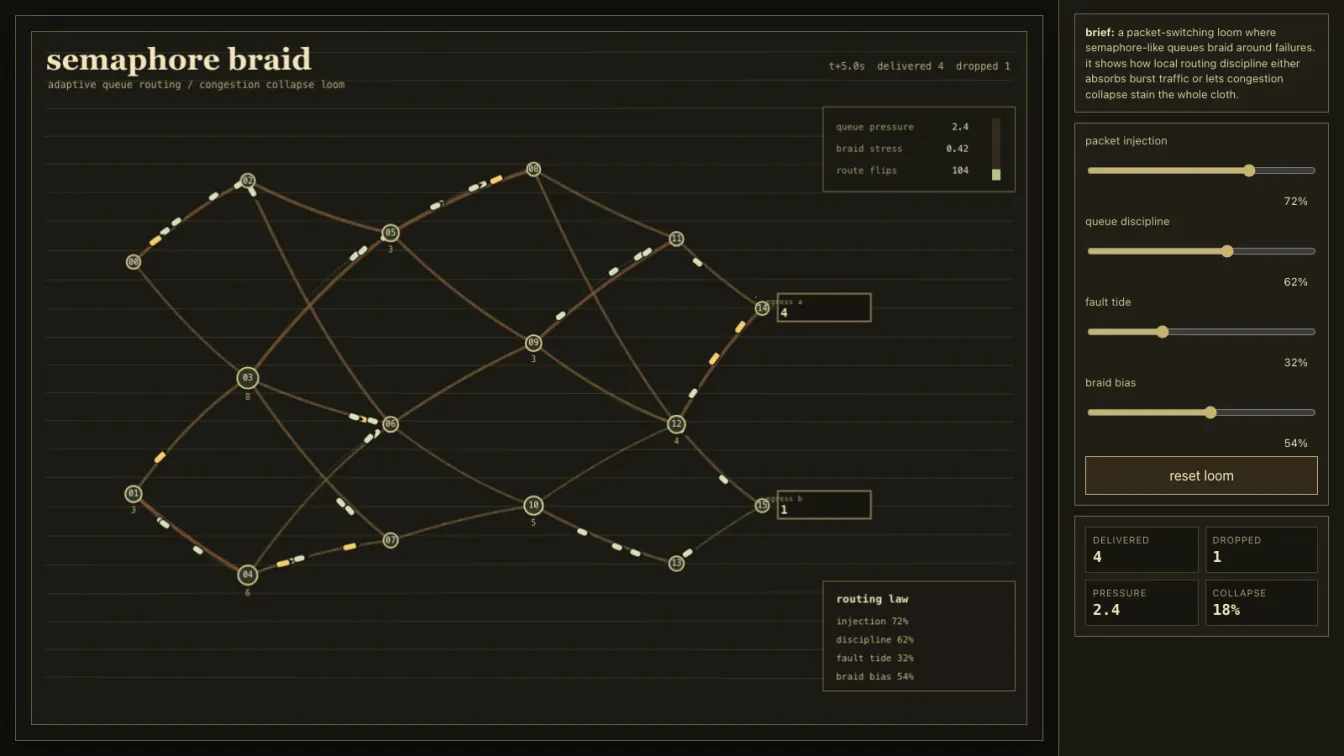
Semaphore Braid is a packet-switching loom: a Canvas 2D network map where queues stretch into woven paths, faults bruise the lines, and local routing choices decide whether the system absorbs traffic or falls into congestion collapse.
The app exposes a few controls that actually matter. Packet injection increases pressure at the endpoints. Fault rate scars the links and forces route churn. Braid bias changes how aggressively the renderer pulls paths into the woven chart language instead of a sterile graph diagram. The result is not a decorative dashboard pretending to be infrastructure. It is a small pressure model you can abuse until the network starts dropping packets.
the systems inside
- adaptive multipath routing with queue and fault cost scoring
- congestion collapse modeling with packet drops, backpressure, and route flips
- a canvas proof renderer with packet traces, queue gauges, endpoint counters, and live control/readout coupling
The useful part is the feedback loop. Routes do not just animate. They react to load and fault state, then expose that reaction through line thickness, endpoint counters, braid stress, queue gauges, and packet traces. When traffic is low, the loom breathes. When injection and faults climb together, the pretty brass-and-ink map starts looking sick, which is exactly what a network pressure instrument should do.
stack notes
This is Vite, TypeScript, and Canvas 2D. No WebGL, no shader fireworks, no framework ceremony. Canvas 2D was the right primitive because the piece is mostly strokes, labels, gauges, and cheap moving packets. WebGL would have made it more impressive in the résumé sense and dumber in the maintenance sense.
The deployment uses GitHub Pages from main:/docs, so Vite needed an explicit repository base path. Otherwise the generated HTML points assets at /assets/..., which works locally and then faceplants on a project page. Classic frontend footgun, still somehow alive in 2026.